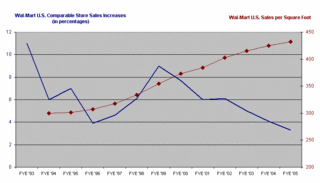
Wal-Mart Comparable Store Sales vs. Sales Per Square Foot

The chart here comes from:
1. Comparable Stores Sales data provided by Wal-Mart and
2. Sales Per Square Foot data that I derived from dividing all U.S. sales by the total square footage of U.S. retailing space. (Wal-Mart reports these figures separately in its 10K filings.)
Obviously Wal-Mart analysts have all been aflutter about the Comp Store Sales figures (the blue line). They are freaking out about the downward trend from 1999.
I don't know, I'm kind of impressed with the steadily rising Sales per Square Foot figures (the red line). The Sales per Square foot figure includes both new and old square footage and up to date sales, so it's not a comp stores sales derivative. As such it is less volatile than the Comp Stores Sales percentages.


2 Comments:
Struggling a bit with how one can have same-store sales decreasing yet at the same time have sales per square foot increasing so much higher...I'd guess the difference can be attributed to newer stores being much more efficient? If newer stores were not included in sales per sqft (for discussion purposes), then in a "static" environment, shouldn't a growth in sales per sqft also dictate an increasing same store sales figure?
That is a very good point, and when I saw the graph I thought the same thing.
The answer is as follows:
1. Comp store sales increases, although declining, are still positive. The increase rate is slowing but comp store sales themselves are still increasing.
2. A decrease in the rate of comp store sales increases would have an effect of lessening the steepness of the slope of the red line (sales per square foot) and to a certain extent you can see the lessening of the steepness of the slope, although it definitely doesn't show up well in that graph.
3. Most importantly: New stores ARE included in the sales per square foot data. New stores are not included in the comp store sales increases data until they have been in existence at least a year. And this leads to an interesting phenomenon. The conversion of Discount Stores to Supercenters causes a big increase in the sales per square foot data, but a decrease in the comp stores sales increases data. If you are interested I can further explain. Just let me know.
Post a Comment
<< Home