Tuesday, September 27, 2005

Reconciling the net income valuation to the cash flow model... Part 1 in a discussion of Wal-Mart's free cash flow

I think it’s time to reconcile the Discounted Net Income valuation for Wal-Mart with a more classic Discounted Cash Flow (DCF) model. As I wrote earlier, I feel it is near impossible to perform a practical valuation of Wal-Mart based on discounted cash flows. This is because Wal-Mart requires massive amounts of capital every year for its own growth (i.e. growth cap-ex). That growth cap-ex is an investment in a future income stream, one that should be significantly higher depending on the growth rate of the company. The “free cash flow,” then, is in a sense artificially low in the near term in order to facilitate a much greater free cash flow in the future.

For those somewhat familiar with free cash flow, let me quickly define the term as I’m using it…

Free Cash Flow =
Net income + Depreciation and Amortization – Capital Expenditures

The above formula gives us the total amount of cash that we can actually take out of the business every year. (Wal-Mart actually does take this cash out of the business every year in the form of dividends to shareholders.)

I am now going to modify the above formula to tailor it more specifically for Wal-Mart’s cash related operations.

Free Cash Flow =
Net cash from operations + Depreciation and Amortization – Capital Expenditures

The “net cash from operations” is different than “net income”. Net income is of course the first line of the cash flow statement. I am choosing to take into account all of the cash produced by operations and this includes things like reductions in cash due to increases in inventories and additions to cash due to increases in accounts payable. The net cash from operations is in fact the whole top portion of the cash flow statement listed under “Operating Activities.” Net income is the first line item in that section.

Now let me quickly indicate how I am defining CapEx from Wal-Mart’s cash flow statement:

Payments for property and equipment
          +
Investment in international operations
          -
Proceeds from the disposal of fixed assets

Initially I thought I would not include the third portion above, but in the end decided to include it as Wal-Mart is slowly selling off its old real estate as they acquire new real estate in the conversion process from Discount Stores to Supercenters. The rebate they get by selling the old real estate (i.e. during the conversion process) should be considered here and so I included it in the calculation.

So, given all of the above definitions, Wal-Mart’s free cash flow in fiscal 2005 was $2.79 billion. That number is obviously significantly less than the $10.27 billion in net income for fiscal 2005. When we go down the road of cash flow analysis we have to be very clear about what is going on, and so in doing the cash flow analysis on Wal-Mart, let’s be very clear that a large amount of Wal-Mart’s net income (and actually even more than its net income) is being re-invested back into the business on our behalf (on behalf of the shareholders). This should not be considered problematic in any way. Remember that it is the RETURN on the re-invested capital, it is the return on that cap-ex, that we then must take into account if we wish to perform a fair and correct cash flow analysis.

I am going to take a break here to allow for all of the above to be digested, and next we’ll begin to analyze what the returns on cap-ex look like.
Sunday, September 25, 2005

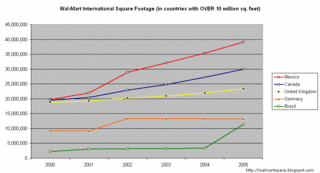
Wal-Mart International Square Footage # 1


Above is a graph of Wal-Mart's international square footage in countries where they have a total of more than 10 million square feet.

Wal-Mart International Square Footage # 2


Above is a graph of Wal-Mart's international square footage in countries where they have a total of less than 10 million square feet.

Wednesday, September 21, 2005

CFO Tom Schoewe presentation

An excellent post-Katrina update is available about Wal-Mart from CFO Tom Schoewe.

This presentation comes from the Goldman Sachs Twelfth Annual Global Retail Conference. Scroll down that page to find the link to Tom Schoewe's presentation.

Also, Eduardo Solorzano gives a detailed presentation on Wal-Mart Mexico.

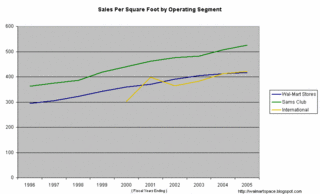
Wal-Mart Sales Per Square Foot by Operating Segment


I think people are digging the graphs, so let me be sure to keep a steady stream of these coming.

In a previous graph (below), I showed how overall sales per square foot had grown every year for Wal-Mart and I juxtaposed this against the slowing rate of comparable store sales increases.

In the graph above I simply break out the sales per square foot by operating segment. The slope of the "Wal-Mart Stores" segment is tapering off ever so slightly in the last couple of years and this has people (mainly stock analysts) freaking out to a certain degree. The steeper the slope upwards, the faster Wal-Mart makes money and the faster it takes sales away from its competitors.

[I did not enter data in the graph for the International segment before 2000. The International segment has a history back to the early 1990's but the data is a bit hard to "normalize" (i.e. smooth out to account for acquisitions etc.) International growth happens for Wal-Mart primarily through acquisition, while domestic growth is primarily organic.]

Hurricane Rita

Hurricane Rita is bearing down on me here in Houston, and I have to evacuate the city. I will post again when I figure out how to get to a computer over the weekend.

Tuesday, September 20, 2005

Competing with Wal-Mart ... Lesson # 1 from Bergdahl's book

Michael Bergdahl says many interesting things in his book, but the main point I got from the book is that if you want to compete with Wal-Mart as a small business retailer, it's going to have to be through specialization and superb customer service.

On page 178, Bergdahl lays it out as openly and bluntly as I've ever heard it laid out. When I read this section, it helped remind me that the backbone of business success in America is hard work and digging out some kind of competitive advantage through that hard work. ..Be advised this quoted paragraph may sound a bit brutal. Is there such a thing as soft and fuzzy competition, though? Real competition?

      "If Wal-Mart's arrival in town is the catalyst for your business to start improving customer service, it is in all likelihood too late. A good merchant by definition should have been providing great service to customers already. Once the big box arrives it is too late to atone for past service sins and you will experience payback from customers who are well aware that they have been historically slighted. When you were the only store in town your customers were forced to shop there, but not anymore. In small towns across America, and the world for that matter, Mom-and-Pop operators who failed to serve their customers have been forced to close their doors upon the arrival of Wal-Mart. In many cases they didn't have to shut down if they had a viable retail concept that could have survived. But higher prices coupled with lackluster customer service causes customers to seek other alternatives."

Saturday, September 17, 2005

Wal-Mart operating margins

Digging into the annual report is necessary to break out the margins of each segment. Operating margin is the only margin by segment that one can derive from disclosures in Wal-Mart's documents. (Gross margin by segment and net margin by segment are impossible to derive at this time.)

Operating Margins by segment   

fiscal years
Jan 2005Jan 2004  Jan 2003
Wal-Mart Stores   7.38%  7.41%    7.54%
Sams Club   3.45%  3.26%    3.23%
International   5.31%  4.98%    4.90%

Operating margin is segment operating income as a percentage of segment sales. This is also known as EBIT/Sales (Earnings before interest expense and tax expense divided by sales).

Remember that the "Wal-Mart Stores" segment includes all U.S. discount stores, supercenters, and Neighborhood Markets. It should be noted that the operating margins in this area are PHENOMENAL, and that this is really the white hot core of all of Wal-Mart's operations. In retailing, operating margins north of 7% are astounding. I need to put in some comparable margins from other retailers to highlight the stupendous aspect of this.

[There is one slight caveat that needs to be mentioned here. Remember that all corporate overhead expenses for Wal-Mart are slotted into the "Other" operating segment (i.e. a segment not included above). Eventually I am going to need to "normalize" the above margins to take the missing corporate overhead into account. Corporate overhead includes things like salaries and bonuses to Wal-Mart execs and insurance. I still have some work to do on the "Other" segment before I can perform this step.]

And now, the million dollar question.. What is Wal-Mart worth? ..okay, $215 billion

I have been working on the problem for some time now, and funnily enough I created a ridiculously complicated spreadsheet which took in lots of different variables such as increasing labor costs, increasing energy costs, increasing future interest rates, increasing taxes, yada yada yada. In the end, I scrapped the puppy. Too damn complicated.

What I did notice in the exercise, though, was that the ultimate answer to this question is simply what is happening at the bottom line, i.e. what will future growth be at the net income line? (..Duh.)

I can mess around with all the variables at the operating level, the interest rate level, and the tax payment level, and cause 1 to 2% changes in the growth rate for net income.

So, here is my simplified result..

Assumptions
Start with FY 2005 net income of $10.267 billion
10% average net income growth rate
10% discount rate
10x multiple in year 2016.

Wal-Mart, using these assumptions, is worth $215.607 billion right now.

Current market value ($183 billion) is at a 15% discount to intrinsic value of $215.6 billion.

[No, this is not a discounted cash flow (DFC) analysis. This is a discounted net income analysis. Buffett followers would chide me for not factoring in Cap Ex and Depreciation. My answer to that is this: I have never really found it useful to do a DCF analysis on a growing retail company. A DCF analysis really is only useful for a retailer that is not going to grow in the future. I don't think Wal-Mart falls into that category. Growth cap-ex is an investment in a future net income stream, one that should be significantly higher depending on the growth rate of the company. At some point, after growth slows to zero, cap-ex will stabilize and net income will become a function of how much operating efficiency can be wrung out of the system. While a retailer is still in growth mode, you can dumb the analysis down to net income (barring anything very unusual). There is lots of growth cap-ex left to come with Wal-Mart, I know. When Wal-Mart stops growing, it'll just be maintenance cap-ex. Eventually maintenance cap-ex and depreciation will cancel each other out. I just did it now to keep things simple.]

Wal-Mart U.S. Store Count By Type


Note the ramp up of the Supercenters in relation to the decline of the Discount Stores. Many Discount Stores have been converted to Supercenters. This conversion process, which will continue in the future, can add to "cannibalization" (a term used by Wall Street analysts to refer to one store taking sales away from another). Wal-Mart itself prefers the term "market development."

Cannibalization, it should be noted, does not refer to the conversion process itself. Cannibalization is a new store taking sales from another still existing store, a phenomenon one would see once a retailer had started to saturate a certain geographic area. A Starbucks opening across the street from another Starbucks would presumably take sales from the original Starbucks. This is called cannibalization because it's a store gobbling down sales from another of its own kind. [...In the Houston Starbucks example, by the way, apparently sales at the old location went up after the new one opened across the street. And yes, they are both doing strong sales. You know you've got a good business when this happens.]

When a Discount Store is converted to a Supercenter, this itself is not cannibalization. It is just conversion from one store type to another. But, due to the conversion process, Wal-Mart experiences a big increase in sales at the new location. SOME of the increase in sales will be from customers NOT shopping at other nearby Discount Stores and instead taking their business to the Supercenter. This shift of shoppers from surrounding Discount Stores to the Supercenter is cannibalization.

The cannibalization process may have a lot to do with the Comparable Store Sales figues decline (see below). If a Discount Store is converted to a Supercenter, both the Discount Store sales (now zero) and the new Supercenter sales are not included in the Comparable Store Sales statistics. But surrounding Discount Stores (open at least a year) are included in the Comparable Store Sales statistics and may face sales loss due to the cannibalization.

Friday, September 16, 2005

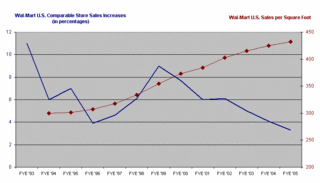
Wal-Mart Comparable Store Sales vs. Sales Per Square Foot


The chart here comes from:
1. Comparable Stores Sales data provided by Wal-Mart and
2. Sales Per Square Foot data that I derived from dividing all U.S. sales by the total square footage of U.S. retailing space. (Wal-Mart reports these figures separately in its 10K filings.)

Obviously Wal-Mart analysts have all been aflutter about the Comp Store Sales figures (the blue line). They are freaking out about the downward trend from 1999.

I don't know, I'm kind of impressed with the steadily rising Sales per Square Foot figures (the red line). The Sales per Square foot figure includes both new and old square footage and up to date sales, so it's not a comp stores sales derivative. As such it is less volatile than the Comp Stores Sales percentages.

The “Other” operating segment

I finally found out what is in the “Other” segment for Wal-Mart (..you know, the one with $44 billion in assets and no explanation). I simply read all the annual reports going back until the first appearance of the “Other” segment. It first appears in the 1998 Annual Report.

In June 1997, the Financial Accounting Standards Board (FASB) issued Statement No. 131, “Disclosures about Segments of an Enterprise and Related Information,” which Wal-Mart adopted in Fiscal Year 1998. Wal-Mart identifies such segments based on “management responsibility within the United States and geographically for all international units.”

All of Wal-Mart’s real estate assets in the United States are included in this “Other” operating category. Those are the primary assets of the category. The real estate is then leased to the Wal-Mart Stores segment and the SAM’S Club segment.

All of the international real estate, by the way, is placed in the “International” segment.

[Back in 1998, by the way, Wal-Mart still owned McLane Company Inc., the grocery distribution business. McLane existed in the "Other" operating segment all the way up until it was sold to Berkshire Hathaway in Fiscal Year 2004. (Sale was completed on May 23, 2003 for $1.5 billion in cash from Berkshire.) Most of the revenue in the "Other" operating segment came from McLane. When McLane left Wal-Mart in FY 2004, operating income for the "Other" segment went negative, i.e. more expenses than income.]

Wal-Mart's stock falls to near 5 year lows

The last time Wal-Mart stock traded under $44 per share was October 30, 2000.

This weakness in the stock price is quite interesting to me because for a long time (i.e. for most of its history as a public company) Wal-Mart employees have been able to build a significant amount of wealth for themselves simply by owning the stock. This phenomenon of employees building wealth for themselves separate from their low salaries has been not only spectacular, it has probably in many ways kept a lid on discontent about the salary levels. Why complain about making $20,000 a year when you've got a retirement nest egg ballooning at $400,000 or so after years of service? [See examples from Sam Walton's autobiography of regular employees building this kind of wealth.]

The lack of ability of regular employees to build wealth from ownership of Wal-Mart stock over the last five to six years could have an interesting effect on the background noise of grumbling over salaries.

To be fair here, Wal-Mart went through a period of zero price appreciation in their stock from 1993 to 1997. That period of zero price appreciation, though, lasted 4 years.

We are currently in about a 6 year stretch of overall zero price appreciation dating back to August of 1999.

How odd that would be if the lack of stock price appreciation over the last six years actually caused Wal-Mart to suffer on an operating cost basis (i.e. having to raise salaries). That's just a bizarre phenomenon, more commonplace I would imagine in a place like Silicon Valley.

S&P 500 index completes move to free-float methodology.. index funds must sell some Wal-Mart stock to comply.

To put this as simply as possible, Standard & Poors announced last year that they were changing their weighting methodology for the S&P 500 index and that this change would occur in 2005.

The S&P 500 is a stock market index comprised of the stocks of five hundred of the largest and most significant public companies in the U.S. and is one of the most commonly used benchmarks for the overall U.S. stock market.

Wal-Mart is part of the S&P 500 and since the S&P 500 is a market capitalization (or “market cap”) weighted index, Wal-Mart (with its enormous market cap) makes up a significant portion of the index.

Since the Walton family owns approximately 39% of all of the stock of Wal-Mart, Standard & Poors considers this portion of Wal-Mart’s stock to be “not available to the public.” Therefore they want to adjust Wal-Mart’s weighting in the S&P 500 to reflect this.

There is approximately $1 trillion invested in index funds that track the S&P 500. Those index funds will need to make adjustments to their portfolio to reflect the new index methodology (i.e. the free-float methodology). Half of the adjustment occurred back on March 18th of this year. The second half of the adjustment is occurring today.

This means you should expect to see an enormous number of Wal-Mart shares change hands today. The trading volume today should easily be twice the normal volume.

The graphic below shows that the index re-weighting will be complete by today.

[Please note that on page 28 of the 2005 Annual Report, Wal-Mart suggests that they will be taking advantage of the index re-weighting to step into the market to buy shares under their current share buyback program. See the first comment on this post for that text.]

Wednesday, September 14, 2005

What actual space does Wal-Mart compete in?

The framework for addressing this question I believe has to be the NAICS (or North American Industry Classification System) which is used by the U.S. Department of Commerce. There is no other more complete framework that I know of.

In my post dated September 9 (below), I outline the four main NAICS categories that Wal-Mart competes in. There are specific reasons for using those four categories. However, I feel reducing Wal-Mart to that set is too limiting.

Let me list ALL of the retail trade categories that exist in the NAICS. When we zoom out to the more macro level, we only look at the first 3 digits of the codes, and those categories break down as follows: (this is the full set of retail)

441   Motor vehicle & parts dealers
442   Furniture & home furnishings stores
443   Electronics & appliance stores
444   Building material & garden equipment & supplies dealers
445   Food & beverage stores
446   Health & personal care stores
447   Gasoline stations
448   Clothing & clothing accessories stores
451   Sporting goods, hobby, book, & music stores
452   General merchandise stores
453   Miscellaneous store retailers
454   Nonstore retailers

Now while I had limited Wal-Mart to the 445 and 452 categories, this isn't exactly correct. Wal-Mart is competing in some of these other categories as well.

Eventhough a "Discount or mass merchandising dept stores" (category 4521102 in the NAICS) sells clothing, the clothes sold there are classified as being sold from a different retail industry than macro category 448 which is "Clothing & clothing accessories stores." Putting Wal-Mart in the first category but not the second is the equivalent of saying that Wal-Mart does not compete with The Gap. ..I think Wal-Mart ultimately does compete with The Gap.

So to take this to a more macro level, I suggest adding up ALL of the above categories and subtracting out "Motor vehicle & parts dealers." ..Wal-Mart doesn't actually sell cars (yet), and it is unclear to me how big they are in the auto parts business. Therefore, I am looking for Wal-Mart's competitive category to be "Retail and Food Sales (excl. Motor vehicle and parts dealers)."

If I do this, and I compare the economic census data to Wal-Mart's total U.S. sales, I find the following:

Wal-Mart's sales account for the following percentages by year of ALL retail sales in the United States (excluding auto sales and auto parts sales)

      1995    4.6%
      1996    4.8%
      1997    5.1%
      1998    5.5%
      1999    5.8%
      2000    6.0%
      2001    6.6%
      2002    7.1%
      2003    7.5%

Wal-Mart data compared to 2002 U.S. Census economic data

Total retail sales in the United States in 2002 for the four NAICS retail categories (listed in post below) were:
$ 828.825 billion

Wal-Mart's 2002 (calendar) U.S. sales were:
$188.822 billion

Wal-Mart's 2002 sales represented 22.78% of the total U.S. sales in the main categories it competes in.

[For detailed information on data source, see post immediately below.]

Friday, September 09, 2005

Wal-Mart data compared to 1997 U.S. Census economic data

I spent a fair amount of time going through the U.S. Census material to try to figure out what the percentage is that Wal-Mart has of the overall retailing space that it operates in here in the U.S.

Let me quickly breakout the 4 NAICS codes that apply when comparing Wal-Mart data to U.S. Census economic data.
They are:

NAICS
code      Description
445110   Supermarkets & other grocery
445120   Convenience stores
452110   Department stores
452910   Warehouse clubs and superstores

Total retail sales in the United States in 1997 for the four categories listed above were:
$670.277 billion

Wal-Mart's 1997 (calendar) U.S. sales were:
$104.488 billion

Wal-Mart's 1997 sales represented 15.59% of the total U.S. sales in the main general categories it competes in.

[I made the selection of those specific NAICS categories above based on the 1997 Economic Census Retail Trade publication by the U.S. Census Bureau published in October 2000. The reference number for this publication is EC97R44S-SB. It may seem odd that I included "Convenience Stores" as Wal-Mart would not seem to compete in this category. I did so because there are only two categories of "Grocery Stores" in the entire census. These are "Supermarkets & other grocery (except convenience) stores" and "Convenience stores." The U.S. Census Bureau generally includes Convenience Stores when they are discussing the overall grocery business. Wal-Mart is in the grocery business. For a more advanced look at all of the NAICS retail categories, see the first comment below.]

9,256 football fields and counting

A football field is 120 yards long by 53 yards wide. (..people often forget about the 10 yard depth of the end zones.)

As of Jan 2005, Wal-Mart had a total of 529,835,000 square feet of retailing space in the United States.

This is the equivalent of 9,256 football fields.

Between Jan 2004 and Jan 2005, Wal-Mart added 678 new football fields of retailing space.

If all of the fixtures and inventory were pulled out of all of Wal-Mart's U.S. retailing space and each store was filled with 1 person per square yard, Wal-Mart stores would hold 58,868,160 people (or 20% of the entire 2005 population of the United States.)

U.S. population growth by state


As you can see in the above diagram, population growth is greatest in the west. If you look at the store saturation map below, you can see that Wal-Mart (as of 1995) had plenty of room to grow out west. I need to try to determine how much Wal-Mart growth has actually happened in the west by 2000 and 2005.

Wal-Mart store growth in U.S. 1970 - 1995


This image comes from Emek Basker's paper on Wal-Mart.

Recent Wal-Mart stock price weakness

It's amazing to see Wal-Mart's stock price hovering down near three year lows lately. The recent low point was $44.53 (on Sep 2nd). Mainly this is an ongoing reaction to the latest quarterly earnings which were released on August 16th.

Operating profit growth and net profit GROWTH for the quarter ending 7/31/2005 were half the rate of the year earlier quarter.

13 weeks ending  13 weeks ending
     7/31/2005     7/31/2004
Net sales growth (yoy)          10.2%         11.3%
Operating income growth (yoy)            6.2%         16.1%
Net income growth (yoy)           5.8%           8.5%


This is especially significant because on page 12 of the most recent annual report (year ending 1/31/2005), CEO Lee Scott goes out of his way to discuss the "outstanding growth prospects" for Wal-Mart.

Also note that Mr. Scott states there is room "for almost 4,000 more Supercenters" in the U.S.
(As of 1/31/2005 there were 1,713 Supercenters. Adding 4,000 more would mean a total of 5,713 Supercenters in the United States. ..That's a lot of square footage!..)

Thursday, September 08, 2005

Wal-Mart's components

There is only one way to break down Wal-Mart’s overall operations in order to gain clarity by its various operating units.

It is the same way that Wal-Mart breaks itself down. There are no separate disclosures other than via the following four segments.

- Core Wal-Mart U.S. operations
- Sam’s Club U.S. operations
- Wal-Mart international operations
- “Other”

Core Wal-Mart U.S. operations are comprised of Discount Stores (the original Wal-Mart store concept), Supercenters, and Neighborhood Markets in the United States.

Sam’s Club operations are comprised of domestic U.S. Sam’s Club stores.

Wal-Mart International operations are comprised of multiple store formats (including Supercenters, Sam’s Clubs, and local brand name stores) all located outside of the United States.

It is unclear to me exactly what is in the “Other” segment, although we do have a couple of clues (which I will mention later).

Operating income (EBIT) by segment        dollars in thousands

fiscal years
Jan 2005Jan 2004  Jan 2003
Wal-Mart Stores  14,16312,916  11,840
Sams Club    1,280  1,126    1,023
International    2,988  2,370    1,998
Other   -1,340 -1,387   -1,566
Total  17,09115,025  13,295


The only bummer about the above numbers is the weighting of the assets in the non-core U.S. segments (as shown below).


Total Assets by segment        dollars in thousands

fiscal years
Jan 2005Jan 2004  Jan 2003
Wal-Mart Stores   29,489  27,028    24,868
Sams Club     5,685    4,751      4,404
International   40,981  35,230    30,709
Other   44,068  38,396    30,709
Total 120,223105,405    92,900


The EBIT return on Assets (EBIT/Assets) from the above tables is as follows for 2005:
Wal-Mart Stores 50%
Sams Club 25%
International 8%
Other -3%
Total (weighted) 15%


What the above tables show is that the shocking returns (EBIT/Assets) on core domestic assets is tempered by the much lower returns on the international and “other” assets.

The real bummer of the above data, of course, is this negative return on the whopping $44 billion of assets in the "Other" category.

Wal-Mart discloses very little about this "Other" operating segment.

What we do know is this:
Corporate overhead is placed in this category.
Seiyu is in this category.
McLane’s used to be in this category.

Since McLane’s is long gone, I am more than a bit befuddled as to what the heck is actually in this segment. ..$44 billion in assets and no explanation? The investment in Seiyu makes up only $670 million of the $44 billion.

(The Seiyu investment will eventually rotate out of “Other” and into “International” when Seiyu is consolidated.)

The only tantalizing figures we have for the "Other" segment for 2005 are as follows.
Revenues from external customers  $ 0
Intercompany real estate income  $ 3,267
Depreciation & amortization expense  $ 1,510
Operating loss  $ 1,340

Based on the above information, I believe that Wal-Mart has put all of its real-estate assets into this "Other" segment. I need to think about this in regard to how to better demystify this segment.