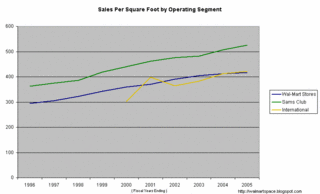
Wal-Mart Sales Per Square Foot by Operating Segment

I think people are digging the graphs, so let me be sure to keep a steady stream of these coming.
In a previous graph (below), I showed how overall sales per square foot had grown every year for Wal-Mart and I juxtaposed this against the slowing rate of comparable store sales increases.
In the graph above I simply break out the sales per square foot by operating segment. The slope of the "Wal-Mart Stores" segment is tapering off ever so slightly in the last couple of years and this has people (mainly stock analysts) freaking out to a certain degree. The steeper the slope upwards, the faster Wal-Mart makes money and the faster it takes sales away from its competitors.
[I did not enter data in the graph for the International segment before 2000. The International segment has a history back to the early 1990's but the data is a bit hard to "normalize" (i.e. smooth out to account for acquisitions etc.) International growth happens for Wal-Mart primarily through acquisition, while domestic growth is primarily organic.]


0 Comments:
Post a Comment
<< Home